CHESTER SQUARE PARK

Time and Space Visualization

Uzma Haque Syeda, Arvindkumar Thiagarajan,Prasanth Murali and Girik Malik

History of Chester Square Park

The waning of an urban oasis in the historic South End of Boston

...................

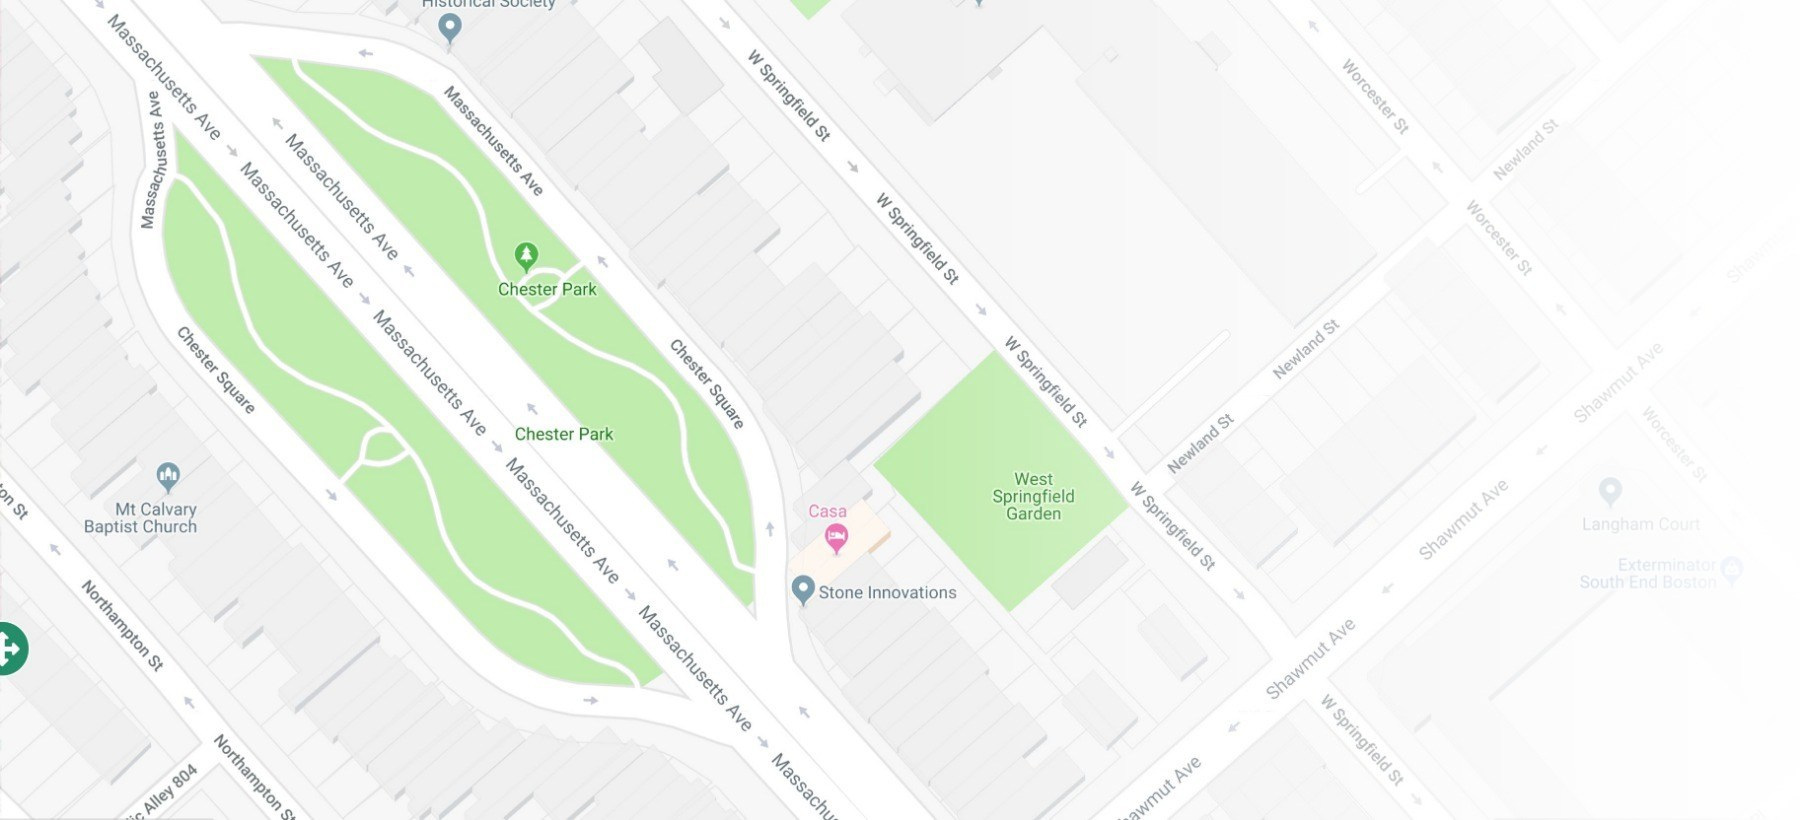
Hover over the picture for current state

The South End of Boston

Known today as the biggest intact Victorian neighborhood in the United States, the South End of Boston was originally a thin strip of land known as the Boston Neck and was surrounded by a tidal wetland. During the 1840s, the downtown and Beacon Hill was becoming congested and therefore the city started adding land to the Boston Neck by packing the wetlands with earth brought from Needham, Massachusettes creating what would become the South End.

Enhancing the newly formed area

In the 1850s, an eminent architect, Charles Bulfinch developed a plan to enhance this newly formed area by creating a handsome, spacious and elegant neighborhood scattered with beautiful gardens and brick and brownstone townhouses emulating the English style. The city hoped that this would prevent the wealthy merchants and professionals of the overcrowded Beacon Hill from leaving the city for the suburbs.

Buidling Chester Square

Chester Square was the heart of this ambitious landscape vision and the first plan of the Square was drawn by civil engineer Ezra Lincoln in the same year. The city, with the prospect of selling housing lots, wasted no time in enhancing the area. The 1850 plan was to improve Chester Square with fences, trees and walks by January 1852.

The Chester Square

According to the 1952 Boston Yearbook, Chester Square consisted of 62000 feet of land surrounded by 987 feet long iron fences that cost $4000. In its center, it boasted a huge three-tiered cast iron fountain built in a 50 feet basin. This fountain alone cost $1000. In 1853, the city took proper care of the Chester Square Park by cutting the trees and watering them. The oval park was narrow at the ends and expanded in the center.

The evolution of Chester Square Park

The luxuriously landscaped garden and the Victorian houses attracted wealthy Bostonians, increasing the property value in the Square. Almost half of the houses were immediately sold in the 1850 auction, and in the following year, many of the other half were sold too. The demand was so high that some houses were also sold for thrice their initial price. In 1858, the name of Chester street was changed to Chester Park.

An urban oasis

In 1878, The Boston Illustrated mentioned that the fountain and the fish pond along with the trees and flowers of Chester Square made the park " a deliciously cool and pleasant spot in midsummer " for the residents.

A simple inexpensive public resort

In 1885, The King's Handbook of Boston also mentioned that the Square " was much frequented by pretty children and trim nursery-maids of the neighborhood. "

Beginning of the End

Due to a national financial crisis, most of the former residents gradually moved out to the newly filled Back Bay or the suburbs and their private homes were now occupied by tenements and lodging-houses for small artisans and waves of immigrants.

The names of Chester Park, Chester Square, East Chester Park, and West Chester Park were changed to Massachusetts Avenue in 1894. This name change is thought to have marked the beginning of the decline of the area.

The ebbing away of the Chester Square

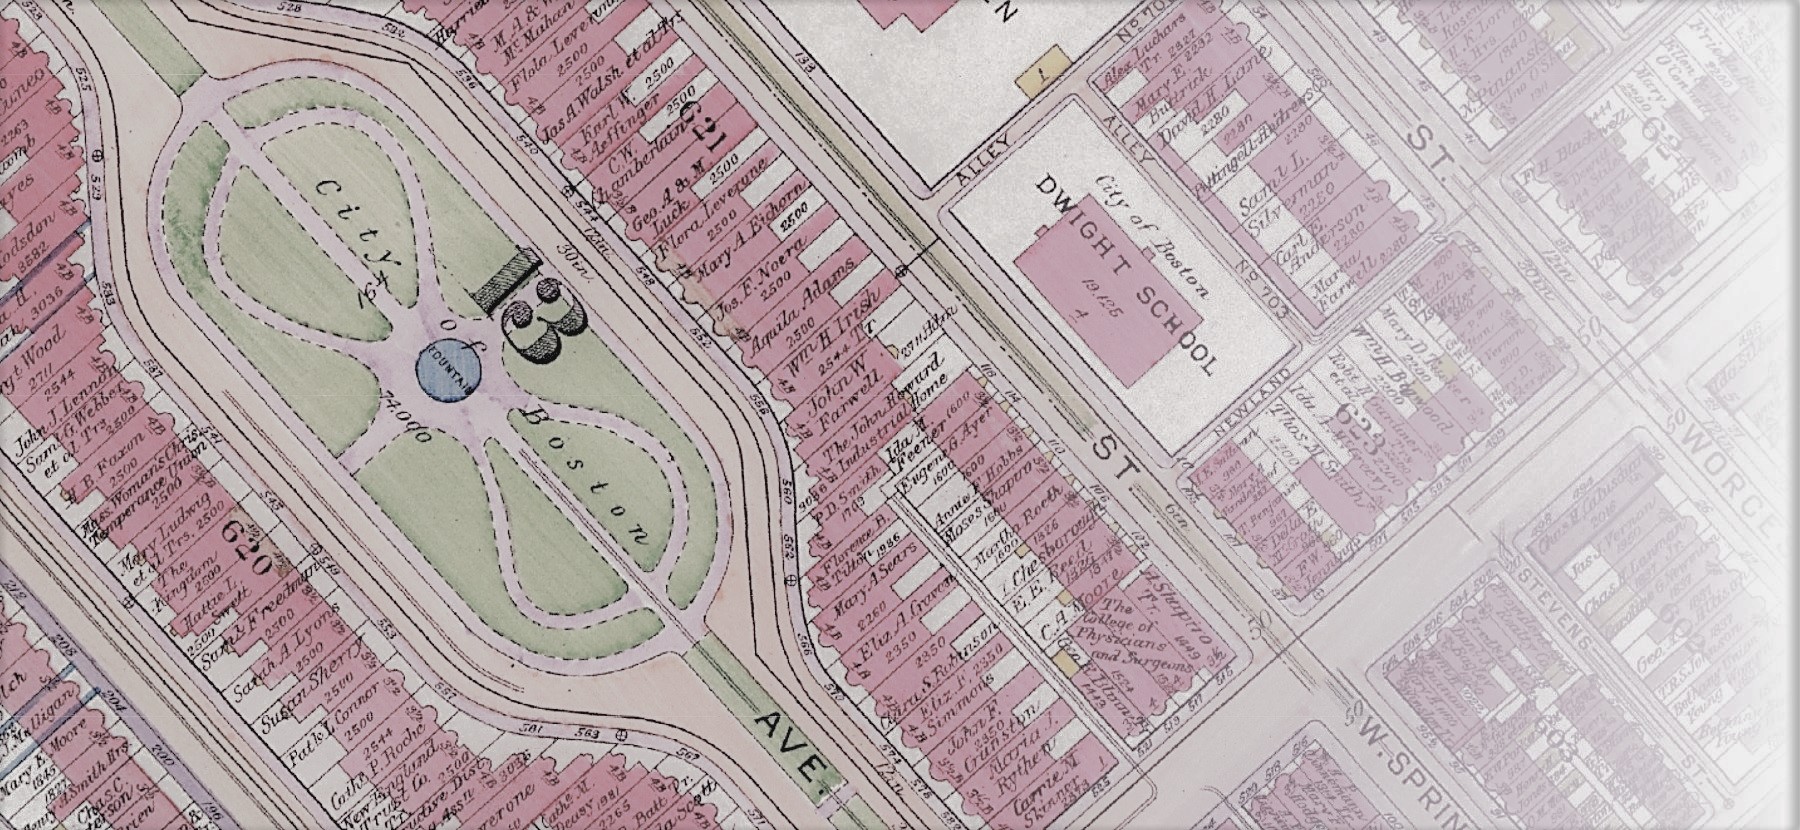
In 1913, the Topographical Map of Massachusetts Avenue was drawn by the Olmsted Brothers for the Public Ground's Department of the city. This plan is a significant touchstone for tracing the evolution of the landscape, as it represented the form and the existing tree population of what had previously been known as the Chester Square and Chester Park.

The ruinous 100th anniversary of the Park

In 1952, Chester Square Park was bisected to make room for 6 lanes of commuter traffic coming into the city from the Southeast Expressway. The heart of the Park was cut out to make way for what is now known as Massachusetts Avenue. The fountain was removed and the landscape form was destroyed.

On its 100th birthday, the center of the historical residential Square became a flowing river of traffic.

The Twin Parks

Shortly after the tearing down of the Park, the Boston Park Department created two narrow parks in its replacement. These twin parks are what is left of the once rich Chester Square Park. Over the decades, the Chester Square degenerated further

During the late 1960s and early 1970s, a 3 feet black steel fence was created around each park and some lighting fixtures were added. Oak trees were planted along with cone shaped brick planters, many of which were broken and contained dying trees.

Efforts to restore the park

In 1992, the city declares plans to redesign Massachusetts Ave to move commuter traffic faster. Residents demand to consider noise, traffic and pedestrian issues. They also demand to consider the restoration of the original park, i.e to join the parks again.

The Mass Ave TaskForce

In 1994, Chester Square community assembles 14 organizations and neighborhood groups to create the Mass. Ave. Taskforce. Neighborhood groups and others also chime in to help restore the park. Hence, the city council makes the Department of Public Works to hold hearings on the plans.

Significant support and funding

In 1997, elected official Representative Byron Rushing secures $1 million appropriation for restoration of the park out of the federal Transportation Bond Bill. City funded feasibility study reports that the original park can be restored. According to Rushing, Chester Square is an example of an urban planning mistake which has the potential to be reversed.

City declines the unification of the parks

In 2000,the city dismisses the option of restoring the park due to rising cost estimates. In 2003, the final street design is presented to the Taskforce by the city. This plan included many resident recommendations aswell.

Negotiation to restore what is left

In 2005, residents fail to convince the city to restore the park to its original footprint despite 10 years of effort, wide community support and even good amount of funding.The unpleasant and bitter trade-off was to accept this and restart by negotiating to restore and improve that what is left of the park: two narrow strips of land, that had been neglected for a long time.

In 2008, the city council approximates fund for the parks' reconstruction and in 2009, everyone attends the ribbon-cutting for the two new parks.

The picture today

Despite having such a rich history the Chester Square Park is no longer widely used by the neighborhood people. The parks are in a state of neglect and is suffering from a lack of proper care today. Many thinks that the parks are not used to its full potential.

Efforts to restore the former glory continues

The Chester Square Neighborhood Association and the Friends of Chester Park believe that the condition of the park can be greatly improved if proper steps can be taken. They work for the improvement of the park and the neighborhood in general. They want to enhance the use of the park to its full potential and bring some of it formal glory back.

Impediments

Some of the issues they seek to solve are the littering problem in the park and the crisis of needle use. They are also concerned about the efficiency of the numerous sidewalks and parking spaces around the park which could also be used to increase the park size and plant more trees.

The Chester Square and South End is a racially, socially and economically diverse place and the aim of the Association is to bring the neighborhood people together in order to promote neighborly interaction, information sharing and discussions of common problems and improving the park is a stepping stone to that vision.

Motivation for this Project

The Chester Square Neighborhood Association seeks to present these information about the current state of the park in a way that will be helpful to make decisions and that is where we come in.

The aim of this project is to help the Chester Square Neighborhood Association to start a conversation about the problems and obstacles that they are facing in regards to enhancing the condition and use of the park so that necessary steps can be taken towards improvement.

Parking and Sidewalk around the Park

The following visualization below depicts the available parking and sidewalk sites around the Chester Square park. Clicking on either or both of parking/sidewalk will highlight the space on the map. Hovering over the line displays information related to parking and sidewalk respectively. In particular, the visualization provides information about the length of sidewalk, the available parking times, number of cars that can be parked and width of the parking area.

Neighbourhood Demography Litter/Space Pollution Visualize the park the way you want it Comparison with other parks

Motivation

The service-learning component of the course is a personal motivation for all of the students involved in this project. We looked to leverage the available resources through the connections of our instructor Prof. Michelle Borkin and our TA Mariella Hidalgo Del Alamo in the Chester Square neighborhood. We were introduced to the Chester Square neighborhood association as well as the Friends of Chester Square, who were closely involved in the development of the project in accordance to best practices of human-centered designs. We started by conducting interviews of these residents and from then on, the work transitioned from being a project to making a difference to the community. For instance, we decided to keep the complexity of the visualizations to a minimum and stick to scatter plots and bar plots, that offer easy readability for all stakeholders and also does take so much of a cognitive load. In addition, the interview also gave us insights about some of the existing problems in the neighborhood and we proceeded to look at it by visualizing the data at our disposal. Thus, this project looks to develop and visualize that data, to enable the residents of Chester Square to make a convincing case about some of the problems plaguing the neighborhood Park.

Data

We used various kind of data in different forms, some of which needed major cleanup and filtering. We also collected some of our own data by visiting the park ourselves. The data sources and types are listed below under the corresponding visualizations that used them:

Task Analysis

Design Process

The first step of our design process was to conduct an interview with our primary stakeholder, i.e the President of The Chester Square Neighborhood Association, Carol Blair. From the interview, we learned about the various problems that we have to look at. Deriving from these insights, we developed a primary task analysis table, dividing domain tasks for our primary stakeholders and also passive stakeholders. Based on this task analysis table, we developed our design sketches.

After somewhat concretizing our plan in the scope of the project, we sought feedback from our stakeholders in order to keep them in the loop of the whole design process. This was helpful as it made us change a lot of our initial plans and modify our initial task table in terms of what we are going to aim at solving and also what is feasible in the scope of the project and the amount of time and data that were at our disposal.

Since we are working with the community and the visualizations are meant to be used by many people, who might not have the skill or time to look into fancy and complicated visualizations, we opt to go with traditional and easy-to-understand visualizations like bar charts, scatterplots area charts, etc. This is to ensure that no one faces a problem with the usability of the visualizations and to further enhance usability we incorporated interactions to these visualizations that will aid in the comprehensibility and make the tasks easier for the user to accomplish. We used overview, details in demand, brushing and linking, brushing and zooming, toggle enabled legends that filter bar charts, the tooltip on hover, etc.

With these design choices in mind, we developed our visualizations and the website and had it go through a usability testing in the classroom to get feedback from others to understand how to improve the user experience further. We initially had a long webpage with all the visualizations on the same page. However, because we have so many different aspects to look at and all of them are of different domains, the users actually preferred different frames for each domain tasks so that they understand which aspect they are looking at at a time. Scrolling through a long webpage was also not approved by many. Another thing we considered was the use of the webpage in a mobile device, where a long single page is never a good option. Therefore, we divided our visualizations into different frames and connected them all with buttons to the main visualization. However, we kept the storytelling (story of Chester Square Park) in the main landing page and as the introduction because we thought it was vital for someone to go through it before looking into the project both because it gives the user a sense of context and also helps them understand and appreciate the significance of the problem at hand.

Final Visualization

The visualization covers the aspects of neglect for Chester Square Park and aims to highlight the important issues with the current state of the park. The design choices in the visualizations are kept simple given the diverse set of stakeholders involved and their backgrounds. Most visualizations are supposed to be intuitive, without the need of having a demo or walkthrough, to understand what data is encoded and what message is the visualization trying to convey.

Most visualizations have been coded in d3 for their ease of providing features like brushing and linking, and also for the possibility of their customization, depending on how would we like to encode certain features. The website has been coded using HTML and CSS (both standalone and with libraries like bootstrap), along with javascript for transitions and dynamism. Part of the reason for choosing client-side scripting was also the homework, which was to be coded in the same manner. In some frames, clicking on a button takes the user to another frame. While it may seem redundant, but it is because both d3 version 3 and version 4 are used and rendering them on the same page was not possible. Excel and Python were used for data processing. Given the humongous chunk of data that we had, we needed something that could process it efficiently and quickly, with sufficient flexibility.

The visualization begins with a storytelling component, walking the user through the past, and present of the park, along with telling them significant historical events about the park. It is to motivate the users (the neighbors) to realize the significance of the park and its rich history and be more willing to contribute and help in improving it.

Below storytelling, is a map of the park, which makes it intuitive for the end-user to decipher what is being talked about. Right below the map, are buttons that link to different visualizations. For e.g., one could toggle between the parking and sidewalk data, that highlights the respective parts of the map and gives information as a tooltip on hover. Below these are more buttons that link to visualizations for demography, litter, trees, and visualizing the future of the park.

The demographics visualization links three scatter plots, brushable and linked to individual records as well as the other two plots. The plots show how the demography has changed over time, and how there are more self-owned houses, compared to rented ones, making a strong point for a rise in popularity of the park in near future, and the importance to start taking actions for it upliftment now.

The litter visualization shows the trend in increased litter in the park and the turn around time for the complaints made to 311 (City of Boston). The increase in litter does signal towards increased use of the park but at the same time a need for increasing awareness among its users about keeping the park and its surroundings clean. Though 311 seemed to be quick in clearing litter but the average turn around time of 100 hours could be reduced significantly.

The tree visualization compares the distribution of trees in parks in close vicinity of Chester Square, and of comparable area. It is evident from the visualization that the park actually ranks somewhere in the middle in such comparison, given the number of trees being more than what other parks of similar size have. This gives another reason why Chester Square should be uplifted, given it serves as a natural respite, right in the center of bustling Mass Ave, connecting the pulsating cities of Boston and Cambridge.

The visualization for looking at the future of the park gives the end user an option to see for themselves how the park would look from the two basic human activities, namely, putting more trash/litter or planting more trees. Although this is something stemming from common sense, that there should be more trees in the park, but psychologically it is more effective to see the park in both states and then make a judgment to keep the park clean and green.

Data Analysis

Through our visualizations, we arrived at some significant and interesting conclusions. The insights garnered from these visualizations will give us a better understanding of the current state of Chester Square park and how it has changed from being one of the most prominent parks to an almost insignificant one. From the comparison visualization, we gained a clear understanding of how small Chester Square park is when compared to its neighbors in the area and the city. The litter data conveyed how badly the park is being misused and poorly maintained while the trees visualization supported that fact by confirming the low number of trees in the park. From the demographics visualizations, we understood the people and age group of the neighborhood and the how this demographic change can be potentially used for the improvement of the park. The parking and sidewalk visualization showed the usage of area surrounding the park. Finally, with the help of the game, we allow the user to interact with the visualization and add trees/litter to the park to better understand how to save or destroy the park. More snippets of data analysis and insights can be found attached to the corresponding visualizations and for more details please read the report for this project.

Conclusion

This work has considerable limitations particularly owing to the lack of available data. Through a more expansive data collection and a meta analysis, we hope to arrive at creating visualizations not only for Chester Square but also develop a framework that can be generalized to different neighborhoods to visulize information pertaining to it such as its demographics, economical information, parking information, traffic, etc. There is also not much information about available green space in the Chester Square. Another direction ths work can be extended that was beyond our scope is include studying the effects of parked cars such as the contributed pollution levels and revenue and effects of removing that parking space and subsequent effects of that for all stakeholders. There is also a necessity to work closely with the residents, take their 'anecdotal' evidence, and using these anecdotes as hypotheses, study that using data. One big takeaway for all os us was that the power of data in today's world extends beyond just graphs and visualizations. It is thus important to carefully analyze it, account for necessary biases and prejudices and ultimately use that to give back to the community.