So that this report should not seem unduly pessimistic, it's important to also forecast the potential to switch to other energy sources. The issue is not whether we can switch, but how much lead time is required (probably through major governmental initiatives) before this can be accomplished. The discussion of oil already shows that the ``invisible hand of the market'' is not going to provide the ten- and twenty-year lead times for the world to switch to a new energy source.
One should also distinguish between two types of energy production: stationary energy production (e.g. electricity power plants and industrial uses); and mobile energy production (e.g. automotive fuel and aviation fuel).
One can classify energy into: non-renewable energy (oil, natural gas, coal, uranium -- all with finite lifetimes); and renewable energy (hydroelectric, biomass, geothermal, wind and solar). On the scale of human civilization, fusion can also be considered as renewable. Note that the term ``solar energy'' is often abused. This happens because all but uranium, geothermal and fusion ultimately is energy coming from the sun (possibly via organic matter from 200 million years ago turning into oil). Even fusion is sometimes called solar energy because the energy production process in the Sun is based on fusion.
In addition to renewable and non-renewable energy, there is energy storage. This provides no new energy, but allows one to store energy when it is produced, and then use that energy at a later time. Examples are water reservoirs (with pumps to push the water uphill), fuel cells, and batteries. The latter two are important as a potential replacement for gasoline in cars powered by fuel cells or batteries [42].
A final category discussed is reduction of oil consumption through greater fuel efficiency.
|
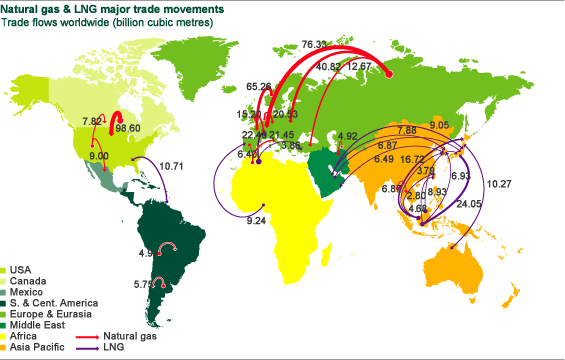
Natural gas is also a finite resource, but its production plateau for
the world may be ten years off or further. 54% of the world's proven
reserves is in Russia, Iran and Qatar [16, BP Statistical
Review]. North America has reached its
plateau now, and will soon be a major importer. Natural gas can and
is imported from other continents by first lowering the temperature to
-259![]() Fahrenheit (-161
Fahrenheit (-161![]() Celsius) to form liquefied
natural gas (LNG). There are (expensive) schemes to use natural gas
as fuel instead of gasoline. See, for example, Conoco's
Gas-To-Liquids (GTL) project with a demonstration plant to produce 400
barrels of oil per day [30].
Some estimate that this process
could become economic with sustained oil prices of at least \$40 per barrel.
This process, if pursued seriously, buys us some transition time after the
peak production of oil is reached. However, many years are needed to
build the full-scale infrastructure for gas-to-liquids. Further,
current natural gas production is only 2/3 of oil production (based
on energy content). Switching
from oil to natural gas would deplete natural gas much faster, bringing
even closer the peak in natural gas prodcution. For general
information on natural gas, see [29]. For more
information on a future peak in natural gas, see the articles of the
Post Carbon Institute [15]. (An alternative to
natural gas as fuel is to use fuel cells or batteries to convert other
stationary energy production into mobile energy production.)
Celsius) to form liquefied
natural gas (LNG). There are (expensive) schemes to use natural gas
as fuel instead of gasoline. See, for example, Conoco's
Gas-To-Liquids (GTL) project with a demonstration plant to produce 400
barrels of oil per day [30].
Some estimate that this process
could become economic with sustained oil prices of at least \$40 per barrel.
This process, if pursued seriously, buys us some transition time after the
peak production of oil is reached. However, many years are needed to
build the full-scale infrastructure for gas-to-liquids. Further,
current natural gas production is only 2/3 of oil production (based
on energy content). Switching
from oil to natural gas would deplete natural gas much faster, bringing
even closer the peak in natural gas prodcution. For general
information on natural gas, see [29]. For more
information on a future peak in natural gas, see the articles of the
Post Carbon Institute [15]. (An alternative to
natural gas as fuel is to use fuel cells or batteries to convert other
stationary energy production into mobile energy production.)
Shale oil is actually kerogen (pre-oil) locked into rocks. Kerogen can be converted into a petroleum-like substance. Most of the world's shale oil (more than 95%) is in the western United States. The difficulty is to extract shale oil in an energetically efficient manner. If more energy is expended in extracting the shale oil than is contained in the shale oil, then the process becomes uneconomic. There are also environmental issues. Shale oil remains today a difficult technological problem, and mass production is not on the near-term horizon [34].
TarSands
The International Energy Agency has a wealth of programs providing international collaboration in renewable energy [35]. Among some technologies not reviewed here are concentrated solar power, solar heating and cooling, and ocean energy (waves). Fusion (see Section 3.1), while technically not a renewable energy, might well have been included in this section since its necessary raw materials are projected to last 1,000 years.
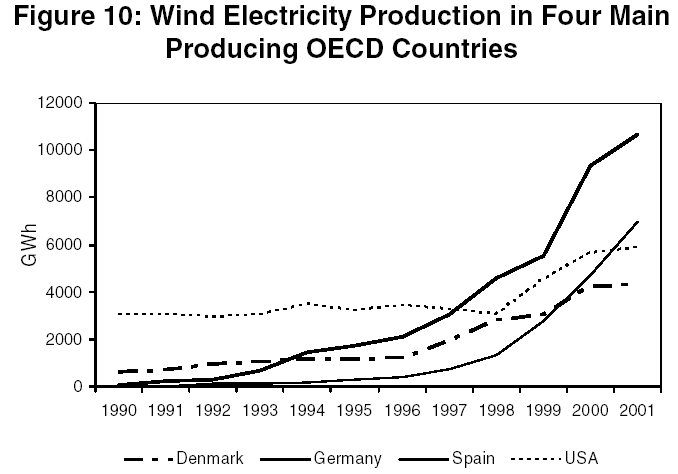
In the United States, there were wind energy tax credits from 1978 - 1985 (Energy Tax Act of 1978) and from 1992 - 2003 (tax credit of 1.7 cents per kwH; Energy Policy Act of 1992, Tax Relief Extension Act of 1999, and Economic Security and Recovery Act of 2001). In Spain, Germany and Denmark, there have also been continuous tax and pricing incentives for wind energy since the early 1990s.
Much of the growth is concentrated in Germany (5% of current electricity production), Denmark (10% of current electricity production) and Spain (5% of current electricity production), with other countries of the European Union also moving toward rapid adoption. Some countries have goals for wind power of 50% of current electricity production. Above that level, there are problems of steady production (the wind is weaker on some days than others), which must be solved by auxiliary schemes for energy storage.
Its adoption in the European Union is motivated by two factors:
lessening dependence on imported oil; and reducing CO![]() emissions in
line with the Kyoto accords [24]. Since the European
Union was already investing in wind energy for the sake of energy
independence, they strongly favored the Kyoto accords. The European
Union hopes to satisfy much of its Kyoto commitments through the use
of wind energy. For each unit of wind energy produced, they receive
an environmental credit for a reduction of the corresponding CO
emissions in
line with the Kyoto accords [24]. Since the European
Union was already investing in wind energy for the sake of energy
independence, they strongly favored the Kyoto accords. The European
Union hopes to satisfy much of its Kyoto commitments through the use
of wind energy. For each unit of wind energy produced, they receive
an environmental credit for a reduction of the corresponding CO![]() emissions from fossil-based fuels (oil, natural gas, etc.). This
reduces global warming.
emissions from fossil-based fuels (oil, natural gas, etc.). This
reduces global warming.
This system of environmental credits in the Kyoto accord was also strongly favored by the United States. Those tax credits expired in December, 2003, and their renewal was tied to a larger energy bill that did not pass. This has discouraged the American wind energy program. General Electric is the primary American company in wind energy -- in comparison with numerous European companies. The United States has declined to sign the Kyoto accords.
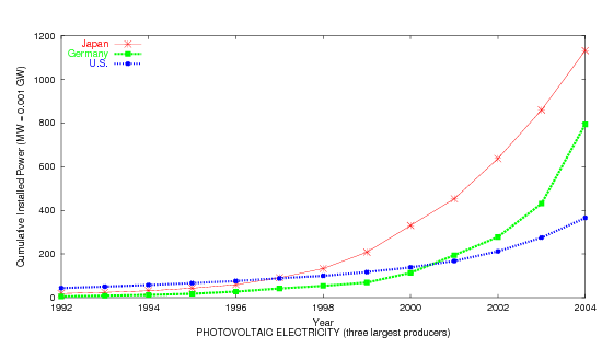
Photovoltaic energy is growing fast (perhaps 30% per year), but is still at low levels (less than 0.01% of world energy production). The largest installations are in Japan (184,000 kW), Germany (82,600 kW) and the United States (44,400 kW) [37]. It currently requires sizable subsidies or other incentives for deployment. It includes photovoltaic cells (PV) to produce electricity directly from sunlight, which is the faster growing component, and solar collectors to produce heat. It cannot grow to 100% since there are some days (and also many nights) without sunlight. The lack of sunlight at night means that energy would have to be stored in the daytime and released at night.
In the United States in 2002, 68% of oil consumption is for transportation (including 45% of oil consumption for gasoline and 8% for jet fuel) [16, EIA Annual Energy Review (Petroleum), Table 5.12c]. The National Energy Policy proposed ``responsibly crafted higher [Corporate Average Fuel Economy] CAFE standards''. In 1975, CAFE standards were introduced that brought average car mileage from 12.9 miles per gallon (18.3 liters per 100 kilometers) in 1975 to 27.5 mpg (8.6 l/100km) for cars and 20.7 miles per gallon (11.4 l/100km) for light trucks (SUVs, minivans, light trucks) in 1985. More than half of new vehicles sold are light trucks. Vehicles over 8500 pounds (3400 kilograms), such as the Ford Excursion and the Hummer, have no restrictions. In April, 2003, the National Highway Traffic Safety Administration issued an administrative rule to boost light truck CAFE standards from 20.7 mpg (11.4 l/100km) to 22.2 mpg (10.6 l/100km) by 2007.
Global warming has now been proven. While it is only about 1 degree Celsius (0.5 degrees Fahrenheit) at moderate latitudes, it reaches 10 degrees Fahrenheit (5 degrees Celsius) in the Arctic. The Arctic Climate Impact Assessment (ACIA) report of 300 scientists and commissioned by the eight nations bordering the Arctic has concluded that more than 50% of the Arctic ice will melt by the end of the century, including parts of the Greenland ice cap [44, ACIA]. A complete melting of the Greenland ice cap would raise sea levels by 23 feet (7 meters) [44, ACIA].
Some ramifications are that Denmark has begun a $25 million scientific investigation to show that the seabed at the North Pole is a natural extension of Greenland. This would give Denmark sole oil drilling rights in that region when the ice pack disappears. Canada and Russia dispute this claim.
Similarly, Canada has begun military patrols of the Arctic to enforce its claim to the Northwest Passage as Canadian waters once the passage there is ice-free during the summer. This is predicted by some to happen as early as 2015, but in any event no later than 2050 [44, U.S. Arctic Research Commission]. Large oil tankers cannot pass through the Panama Canal, and must currently pass around Cape Horn in South America. By 2050, the Northern Sea Route long northern Siberia will also be ice-free during summer [44, U.S. Arctic Research Commission].
Carbon dioxide (CO![]() ) has been definitively shown to be a cause
of global warming. CO
) has been definitively shown to be a cause
of global warming. CO![]() (and
methane) are called greenhouse gases because, like greenhouses,
visible sunlight passes through, but heat (in the form of infrared
radiation) is trapped when it tries to escape into outer space.
(and
methane) are called greenhouse gases because, like greenhouses,
visible sunlight passes through, but heat (in the form of infrared
radiation) is trapped when it tries to escape into outer space.
Complete combustion of a gallon of gasoline produces 19.8 pounds of carbon dioxide. Coal produces 2.8 pounds of carbon dioxide for each pound burned. Natural gas (which is primarily methane) produces 2.75 pounds of carbon dioxide per pound of natural gas.
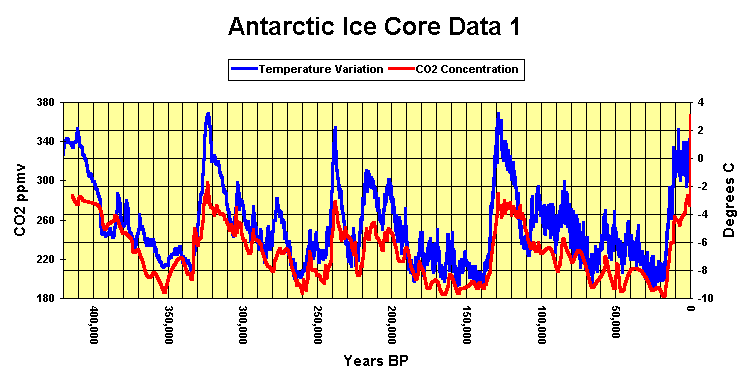
Figure 21 shows historical levels of CO![]() and
its close correlation with temperature. Notice the sharp increase of
CO
and
its close correlation with temperature. Notice the sharp increase of
CO![]() levels at the right. Figure 22 shows the
close correlation of CO
levels at the right. Figure 22 shows the
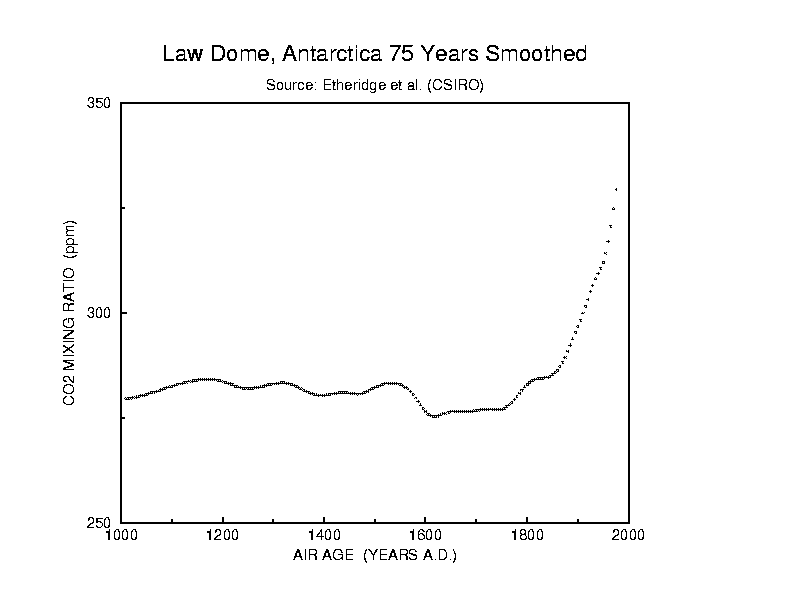
close correlation of CO![]() levels with the rise of industrial
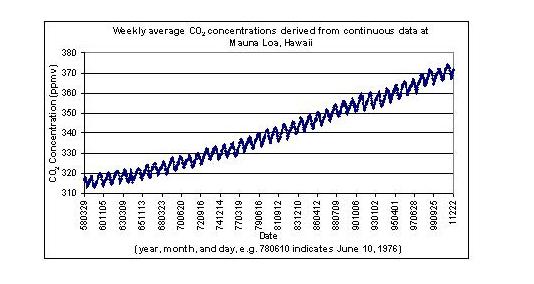
civilization. Figure 23 demonstrates the accelerating
rise in atmospheric CO
levels with the rise of industrial
civilization. Figure 23 demonstrates the accelerating
rise in atmospheric CO![]() content by about 35% over pre-industrial
levels. It also indicates a current increase in CO
content by about 35% over pre-industrial
levels. It also indicates a current increase in CO![]() levels
by 0.4% per year.
levels
by 0.4% per year.
Hence, the CO![]() levels are clearly caused by mankind. Finally,
climate models definitively show the 50% increase to have a strong
effect on climate.
levels are clearly caused by mankind. Finally,
climate models definitively show the 50% increase to have a strong
effect on climate.
|
|
|