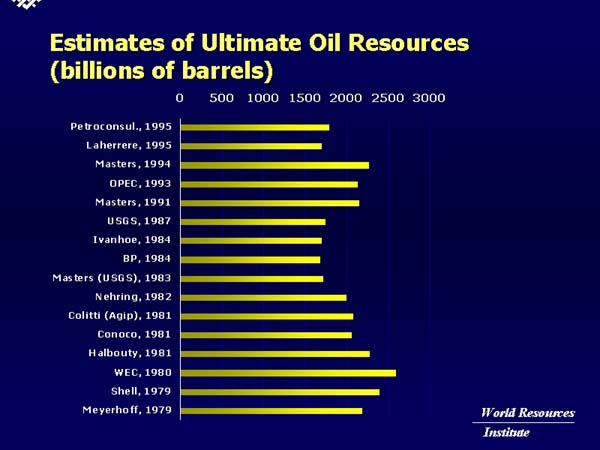
Oil is decayed organic matter, that has been chemically altered by the heat below the earth's surface over millions of years. Hence, our endowment of oil in the ground is finite. The world's endowment of ultimately recoverable oil resources (past production plus future extraction) has consistently been estimated in the range from 1800 billion barrels to 2400 billion barrels in estimates from 1979 onwards [18]. Most of the world has been explored using the latest technology (e.g. high resolution seismic imaging). (This is similar to the way in which schools of fish can be detected through sonar, resulting in many fishing areas becoming ``fished out''.) There will not be any large surprises in future estimates of recoverable oil.
The good news is that we have consumed only about 900 billion barrels (less than half), and that we currently consume only about 30 billion barrels per year. This leaves from 900 to 1500 estimated ultimately recoverable (EUR) oil in the ground. The bad news is that historically in a given region, as the EUR (remaining oil) approached the halfway mark, the yearly oil production has reached a plateau and then declined. Peak discovery of new oilfields over the entire world occurred in the 1960s, followed by a declining rate of discovery in the last forty years. New discoveries are now far below the replacement rate for current production. Living off of forty year old oil fields is inconsistent with economic growth, which requires ever increasing amounts of oil.
This section can give only an overview of the very persuasive arguments why we will soon face the end of cheap oil. For a detailed understanding, I strongly recommend some of the fast growing number of articles and books on the subject [10,11,12,13,14,15].
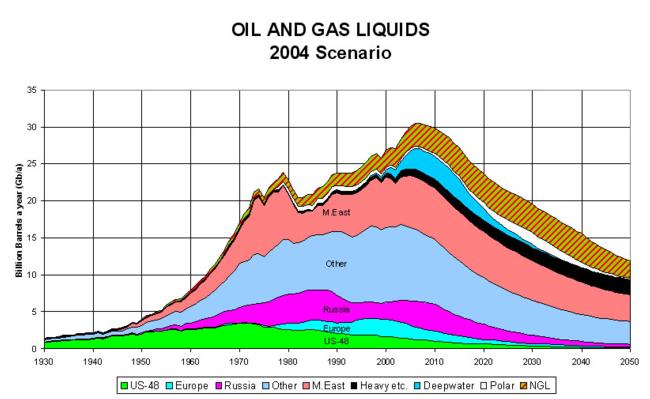
When will we run out of oil? Never. When will we reach peak oil production? Soon (2007-2012) [14, ; also Figure 8]. The issue is not the ``end of oil'', but rather the ``end of cheap oil''. We do not present a doomsday scenario. Eventually, alternative energy sources will come to the fore. We present an oil price shock scenario, with long gasoline lines, wrenching economic adjustments, and trillions of dollars of profits at stake for major companies. (The estimated trillion barrels of oil reserves, at $35 per barrel, is $35 trillion.) This scenario can be alleviated, but only with sufficient planning for alternative energy sources.
The standard economic arguments show that there are 40 years of ultimately recoverable oil in the ground. The arguments are correct, subject to two assumptions. First, the arguments assume that with enough economic incentives, one can extract oil from the ground in ever increasing quantities -- until the day on which the last drop is extracted. Second, they assume that the demand (and so the production) for new oil will remain constant, or grow at current rates, even as third world economies join the first world. Both assumptions are false.
The idea of ever increasing oil production until the last drop is contradicted by past experience. Production in major oil regions around the world follows a bell curve over time. Production grows in the first phase, reaches a plateau in the second phase, and declines in the third phase. The United States is a good example of this historical trend. The United States reached a peak level of oil discovery in the 1950s and a peak level of oil production in 1970 (See Figure 2.). In 1956, M. King Hubbert predicted the 1970 peak, which is often called a Hubbert Peak. With oil prices rising, the peak number of oil wells drilled was in 1981. With little new oil remaining in the ground, the number of oil wells drilled then declined. Today, the United States imports about 60% of the oil it consumes. The single largest exporter of oil to the United States is Saudi Arabia. (North and South America, combined, are a net importer of oil. See Figure 10.)
|
In the mid-1990s and later, many respected geologists applied the Hubbert methodology to world oil production. See, for example [10,11,13] from Scientific American, Princeton University Press and other sources. The various studies all concluded that we would reach peak oil production before 2010.
So if we are entering a plateau in the production of oil, can the economy continue without problems until the big decline? Unfortunately, no. Except for when we are in recession, the economic demand continues to rise. Recent history provides an example. In November, 2001, world oil production was 77 million barrels per day. In May, 2002, world oil production had fallen to 76 million barrels per day due to the world recession. By December, 2003, oil production rebounded to a new record of 82 million barrels per day, as gross national product rose around the world. Hence, if economic demand for oil continues to rise rapidly, and if the current oil production plateau does not rise fast enough to meet rising demand, then the result will be another large oil price shock, leading to another world recession. That recession would reduce consumption, as happened in 1973 and 1979, thereby advancing the year of peak production.
Although the United States consumes 25% of the world's oil, the fastest growing demand is among the rapidly growing economies of East Asia. China is now the world's largest consumer of oil after East Asia. China's consumption of oil is growing at a 10% annual rate. (This is the result of a switch from bicycles to cars in many cities along with a large growth in air travel. For example, in 2002, there were 3 million sales of new automobiles and light trucks in China, as compared with 17 million for the United States.) Between China and the United States, oil consumption is increasing annually by 1 million barrels per day [16, OMR].
Most of today's oil consumption cannot be easily switched. In the oil shortages of 1973 and 1979 in the United States, electricity generators switched from oil to natural gas, and residences switched from home heating oil to natural gas. Gasoline consumption did not diminish as greatly. These easy reductions have now been accomplished. In the United States, 68% of oil consumption is for transportation (including 45% of oil consumption for gasoline and 8% for jet fuel) [16, EIA Annual Energy Review, Table 5.12c]. Vehicles such as SUVs (sports utility vehicles) can be retired in favor of vehicles with higher fuel economies, but this takes place over five years or more. During the next oil price shock, it will no longer be so easy to reduce consumption.
Another issue is refining capacity. The capital cost of a new oil refinery corresponds to a 20-year payback period. While experts disagree about when the oil peak will occur, most are sure that it will occur within the next 20 years (before 2024). So, any new oil refineries may not be able to pay back their construction costs. In 1978, refinery capacity reached 17,048 barrels of oil per day, while total U.S. consumption was 18,847 barrels per day. After the 1979 price shock, consumption declined, but has recently returned to record levels. In 2002, refinery capacity was only 16,785 barrels per day [17, EIA, Table 5.9], while consumption had risen to 19,656 barrels per day. Internationally, most new oil refinery capacity has been built in East and South Asia and Iran and Brazil.
Economists have argued that higher prices always bring higher production. A rise in oil prices to $100 per barrel (from its current $35 per barrel) will indeed raise production through radically new technologies. But new technology cannot find new oil, since most of the Earth has already been explored. What new technology will do is bring existing oil out of the ground more quickly and at a lower cost. However, new technology will require 10 or 20 years to come on stream, as seen during the oil price shocks of 1973 and 1979. Hence, new technology cannot prevent us from reaching peak production and then declining over the next five years. It serves only to soften the declining production afterwards.
|
Can we discover giant new oil fields in other parts of the world (similar to the discoveries of Alaskan and North Sea oil)? We answer that question with a one-paragraph course on geology. Oil (and natural gas) are found where decaying plant and animal matter had been deposited many millions of years. These areas tend to lie near the mouths of ancient rivers and bays (fertile crescents). While rivers can shift their course, most current oil producing regions tend still to be near the mouths of large rivers. As examples, we have Texas and Louisiana near the Mississippi, offshore Brazilian oil to the south of the Amazon, North Sea oil near the Rhine, older Rumanian oil near the Danube, Angolan oil near the Congo, Persian Gulf oil (Saudi Arabia, Kuwait, Iraq, Iran, etc.) near the Tigris and Euphrates, Chinese oil near the Yangtse, etc. Alaskan and Siberian oil seem to stray from the pattern. However, the oil-finding technology has improved to such a great extent (similarly to fish-finding technology in the fishing industry), that most geologists are convinced that the only current hope for giant new oil fields is those regions that were previously closed to exploration for political reasons. For further details, consult your local petroleum geologist.
Can some of the current oil-producing countries produce more oil? Most of the oil-producing regions are now declining. However, there are some notable exceptions. The first exception includes tar sands (bitumen and synthetic crude oil, see Section 3.1) and deepwater drilling where off-shore oil used to be too difficult to find and develop. Examples include Canada's tar sands and off-shore drilling in Brazil and Angola. These drilling sites take advantage of oil field discoveries made possible during the last wave of new technology. The second exception occurs in oil-producing regions that have been politically sensitive or did not have access to the latest technology. Examples include Iraq, Iran, Libya, the Caspian Sea (Kazakhstan/Iran/Russia) and the South China Sea. The first three countries faced import restrictions from the United States and other countries. The South China Sea has not been developed because the Spratly Islands in its middle are claimed by six different countries.
So, we are ready to do the approximate sums for each region: Americas; Europe/Former Soviet Union; East/South Asia; and Middle East/Africa. Over the next five years, the rising capacity in Canada, and Brazil will be balanced by the declining capacity in the United States, Colombia, Venezuela and Argentina, while Mexico and Ecuador remain near their plateau. (However, the deepwater Gulf of Mexico oil coming on line in 2006 may even forestall this decline.) The slowly rising capacity in the former Soviet Union will be balanced by the declining capacity in the North Sea (U.K. and Norway). East Asia, South Asia and Australia are as a whole holding roughly steady. Declining capacity in China, Indonesia and Australia is balanced by increasing capacity in Malaysia and Vietnam.
This leaves the Middle East and Africa as the primary hope, with Saudi Arabia and Iraq as the two countries with potential large new reserves to bring to market. Together, they have more than half of the proved reserves of the Middle East/Africa and one third of world proved reserves. Iraq is especially attractive because it may have the largest undiscovered oil endowment in the world. Oil exploration was halted with the 1991 U.N. sanctions. So, many presume that there are 12 years of postponed exploration waiting to be added to Iraq's oil reserves. Further, only these two countries have the excess capacity available to raise their production by at least 1 million barrels per day within a single year. With oil consumption increasing each year between 1 million and 2 million barrels per day, Saudi Arabia and Iraq must fill most of the growing gap. (See Figure 11.)
If Saudi Arabia and Iraq can each double their previous peak oil production, then the world oil peak will be pushed beyond 2015. Such a doubling would add an additional 15% to the world production capacity. This would buffer the world against increasing oil consumption and declining production in the rest of the world.
|
A natural first step would be to examine the published proven reserves of the two countries. Unfortunately, these do not provide a reliable guide. Table 1 tells the story. Through 1986, proven oil reserves were reported according to standard industrial practice. From 1987 to 1989, there was an internal oil reserves war among OPEC nations. The reason was that OPEC production quotas are set based on published oil reserve figures. Hence among OPEC nations, proven oil reserves have become not just a technical measure, but also a political statement about their rightful share of production quotas. Hence, all OPEC nations have kept their published reserves since 1989 within narrow margins -- largely unaffected by new oil discoveries or by cumulative depletion through ongoing production.
Saudi Arabia has historically acted as a swing producer, withholding oil from the market in order to support higher prices. Saudi Arabia produces much of its oil from immense 50 year-old oil fields (see Figure 12). Due to the secrecy surrounding Saudi oil, it is not clear whether Saudi Arabia has the potential for increasing production or only for steady production. In general, official reports are somewhat arbitrary. For example, in 1985, most OPEC governments raised their estimated oil reserves by 50% as compared with the preceding year. Since that time, officially estimated reserves have stayed approximately constant -- despite OPEC having produced large quantities of oil since then.
|
Recent Saudi statements and external analysts have cautioned not to expect too much additional Saudi oil production in the near term [1]. In January, 2004, ``OPECs secretary general Purnomo Yusgiantoro told the Financial Times in Jakarta Wednesday, that OPEC members are producing `near maximum capacity', and could do no more to stabilise the market.'' [3] In March, 2004, Saudi Aramco officials, Abdel-Baqi and Saleri, announced that the current production capacity of 10 million barrels per day could be increased to a sustainable 12 million (medium-term) and eventually 15 million barrels per day in the future. There is some uncertainty, but it seems clear that Saudi Arabia will not be doubling its production capacity [5]. A recent New York Times article provides an expert consensus of a future Saudi capacity of 12 million barrels per day (representing a 4% rise in world production) [4].
Iraq is the other hope for raising world production. Iraqi oil was nationalized in 1972. Since then, there has been little new exploration, in part because western oil companies were restricted from exploration by the U.N. sanctions on Iraqi trade beginning in 1991. Most other countries have had access to enough Western technology (e.g. e-D seismic imaging) to make estimates of ultimately recoverable oil -- but the U.N. sanctions prevented this from occurring in Iraq. Hence, estimates of Iraqi ultimately recoverable oil vary widely from half the officially stated reserves (because estimates were inflated by many OPEC nations in the mid-1980s) to triple the officially stated reserves (because of the potential discovery of new Iraqi oil in its western deserts).
The prediction of peak oil in the time frame 2007-2012 depends on two assumptions: the Hubbert model predictions; and the ability of Saudi Arabia and/or Iraq to fill in the shortfall. If world consumption continues to grow at its historic rate of 1.3% per year, then an economic shock will even occur during the plateau phase, prior to the peak production. So, the Hubbert methodology is important to understand.
First, a brief lesson on oil reservoir physics is in order. In a given oil field, oil production over time proceeds in the shape of a bell-shaped curve. The reason is that oil production is fundamentally different from natural gas production. If greater natural gas production is desired, one drills additional wells in the natural gas field -- at least until the field is exhausted. This does not work for oil. Oil is pushed through the ground under pressure until it seeps into the region of the oil well. Initially, the pressure is high and the oil well produces at full capacity. Over time, pressure diminishes, the oil seeps through the ground more slowly, and the production of the oil well slows down. Additional oil wells further dilute the available pressure. So, two oil wells in a field do not yield double the production of one well.
A mature oil field with modern extraction technology experiences a typical natural depletion rate between 4% (more viscous, slower flowing oil) and 9% (less viscous, faster flowing oil). For a country as a whole, this depletion rate is slowed due to new discoveries. There are technical means to accelerate production from a declining oil field (thus yielding a higher depletion rate). But such measures risk leaving stranded oil in many small, inaccessible pockets. Proper management of an oil reservoir leads to an ultimate recovery of between 35% and 60% of the original oil.
The Hubbert peak can be predicted in one of two ways. The two versions of the Hubbert model roughly agree and both predict a peak in the range from 2007-2012, according to calculations by several petroleum geologists.
The first method is to simply fit the past oil production to the initial portion of a bell-shaped curve (e.g. Gaussian curve) and to then extrapolate. (In Hubbert's original paper, he also constrained the curve so that the total oil produced corresponded to his best educated guess of ultimately recoverable oil.) The second method depends on accurate estimates of the world's ultimately recoverable oil. Historically, peak production has occurred at the point where half of ultimately recoverable oil has been consumed (future production equals past production). The rest is simple arithmetic. One applies the estimated quantity of ultimately recoverable oil and the estimated rate of consumption, to determine the point at which half of the ultimately recoverable oil will have been consumed.
Figure 13 shows the Hubbert prediction made by Campbell and Laherrère [11], and Figure 8 shows a more recent estimate in 2003 by the ASPO (Association for the Study of Peak Oil) [15]. The curves were obtained by taking Hubbert curves for each individual country and then adding them. All major producers have already reached their Hubbert peak except Canada, Brazil, Angola, Nigeria, Vietnam, Kazakhstan and some countries of the Middle East.
|
As a simple application of the second Hubbert model, one knows that a figure of 900 billion barrels of oil had been consumed by 2002. World consumption of oil is approximately 30 billion barrels of oil per year. (A barrel is 42 gallons or 159 liters of oil.) Assuming an estimate of ultimately recoverable oil of 2100 billion barrels, the halfway point is reached when cumulative consumption reaches 1050 billion barrels of oil. This will occur five years after 2002, or in 2007. If one assumes 2400 billion barrels of recoverable oil, the halfway point occurs in 2012 with 1200 billion barrels consumed. Figure 14 shows a range of estimates of recoverable oil.
|
Much of the future oil projections depends on the estimated ultimately recoverable oil (EUR). Ideally, the EUR oil is constant, since it represents all past and future production. Hence, one hopes for general convergence of opinions with time, since eventually all of the future production will be converted into past production.
Through 1995, the conventional wisdom placed EUR at 1800 to 2400 billion barrels of oil. As seen in Figure 15, the United States Geological Service (USGS) embarked on a major departure in 1996 [19]. From 1981 - 1993 (over twelve years), they raised their estimate by about 33%, but remained within the same range as other studies. Then, from 1993 - 2000 (in the next seven years), they raised their estimate by an additional 50%.
The higher estimate was driven primarily not by new data, but by a new interpretation of the data (a new methodology). The increase represents the combination of a doubling of ``undiscovered resources'', and a new category, ``reserves growth''. Reserves growth accounts for future estimates of oil that will be recoverable from today's existing oil fields. (In fact, the 1996 report appeared only in 2000. Further, the USGS included a minimum estimate (5% probability) and maximum estimate (95% probability). We refer to the mean estimate (50% probability).)
There exists some controversy over the introduction by the USGS of the ``reserves growth'' category. To paraphrase the concept, the USGS expects that future estimates of the recoverable reserves in today's oil fields will be larger than today's estimates of recoverable reserves in today's oil fields, and it wishes to apply those future estimates today. The USGS explains this reserves growth in part by a future commercialization of improved oil extraction technologies. Unfortunately, the USGS reserves growth is based purely on extrapolations from the past. If commercialization of new technologies will occur in the future, then it must come from technologies that are being tested today. The USGS studies do not attempt to identify these new technologies. For a deeper analysis of the effect of reserves growth, see Oil Reserves Growth Potential [20]. Similarly, there is controversy over the USGS doubling of the ``undiscovered resources'' category.
The new USGS estimate is the basis for new estimates by the World Energy Outlook 2001 [19,16, Chapter 2], published by the International Energy Agency. This is likely also to be followed by the International Energy Review 2003 of the Energy Information Administration of the U.S. Department of Energy, which will be published in 2004.
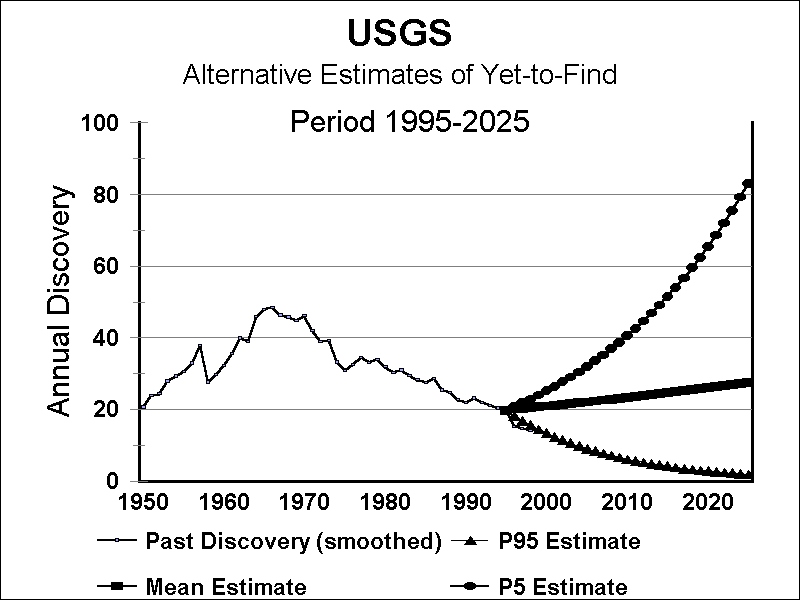
Since the USGS estimate is based on 1996 data, we will soon have more evidence. Both the USGS estimate and short-term extrapolations predict rising production. But short-term extrapolations predict declining discoveries of new oil fields, while the USGS estimate predicts level discoveries. The data is not smooth, since discoveries of large and giant oil fields are rare. Post-1996 data to date seems to contradict the USGS estimate (see Figure 16), but the picture will soon come into sharper focus.
|
This leaves us with the conventional wisdom of the 1994 USGS study and the strongly conflicting conventional wisdom of the 2000 USGS study. Either the conventional wisdom was wrong in 1994, or it was wrong in 2000. Many petroleum geologists believe that the 2000 assessment is wrong. (See, for example [21].)
In particular, the USGS ``remaining reserves'' of Figure 15 are probable reserves. The ``reserves growth'' and the ``undiscovered resources'' are additional quantities. The ``reserves growth'' refers to the hypothesis that the probable reserves for today's existing oil fields will have higher evaluations in the future than they do today. The ``undiscovered resources'' refers to probable reserves in future oil fields that have not yet been discovered. The total of all quantities corresponds to EUR (estimated ultimately recoverable) oil.
Finally, all of the above refer to crude oil production. Total oil production includes crude oil (from oil in ground), natural gas liquids (NGL, liquids recovered from natural gas plants), condensate, refinery gains and other liquids (such as experimental gas-to-oil and coal-to-oil projects). Crude oil itself is sometimes divided into conventional oil (technologies with a long history) and non-conventional oil (newer technologies, such as mining tar sands), but the boundary between the two categories is not always a sharp one. The quantity of concern for the future is total oil production, and not simply crude oil production.
Economists sometimes argue that there is also a future oil bonus waiting, based on future technologies that are unknown or unproved today, but will be developed under the pressure of higher oil prices. This is often disputed by petroleum geologists, who argue that for conventional oil, the historical record of new technology has been to accelerate the extraction of the probable reserves of oil, but not to increase the total probable reserves. Non-conventional oil (deepwater drilling, polar regions, tar sands) is, by definition, new oil that is made possible only by new technology. Unfortunately, all estimates agree that these additions are a relatively small portion (up to 20%) of the world's oil endowment. Shale oil could be an exception, but it has resisted billion dollar projects to extract the oil economically (see Section 3.1).
Why is oil depletion not in the press? It does occasionally appear in the press [12,11]. A search on the web also turns up the occasional article. But it does not make the headlines. Since no corporations or politicians are stressing the issue, the press does not either. Nevertheless, many petroleum geologists no longer associated with an oil company have talked about the problem, and written articles and books on the topic [10,11,13].
Why does the oil industry not publicize the issue? The oil companies do not stress the issue because they prefer stable markets with predictable prices. Large price swings are bad for profits, since drilling becomes unprofitable in the years with low prices. Additionally, there is a sector that sincerely believes that as non-OPEC countries run out of oil, the OPEC countries will be able to pick up the slack. (See [1,3] for a refutation of this view.)
For the longer term, the oil industry is not eager to announce in advance the end of cheap oil. This would cause governments to accelerate the transition to reduced oil consumption and alternate energy sources. Some governments (for example, California in the United States) are already experimenting with selective purchases of hybrid vehicles and vehicles using alternate fuels. If hybrid and alternate fuels were mandated as part of stricter program of corporate average fuel economies (CAFE), this could eventually cut oil consumption in half in the developed world. This is the same reason that OPEC raises prices higher, but not ``too high''. Additionally, governments have historically reacted to crises in energy by pouring billions of dollars of subsidies into alternative (non-oil) energies, which then directly compete with the oil industry (see Section 3.2).
Why do the politicians not raise the issue? For some insight, consider the politicians' lack of eagerness to talk about Social Security. (Social Security has a large natural constituency that is eager to put the issue on the national agenda. Oil does not.) To put it another way, Jimmy Carter was the last president to seriously emphasize lessening dependence on oil. He did not win re-election. Hence, if any sharp rise in oil prices can be delayed until after the following election, then the politicians will be happier.
Nevertheless, while the Bush-Cheney administration does not publicly discuss oil depletion, they have made oil and energy a major policy issue. Both Bush and Cheney are ``oil men''. The first major action of Vice President Cheney upon taking office, was to organize the Energy Task Force, resulting in the White House National Energy Policy [6].