Excel application has been designed to help in designing programs that represent typical computations used in the business world and in modeling dynamic behavior.
When we decide to use Excel to solve or model our program, we start with problem analysis and data definition. We need to think about the information available to us and about the information we would like to obtains as the result of some data manipulation and computation.
But, what is data? Data is a representation of the essential pieces of information. We must decide what information relevant to our problem is relevant, and how can it be represented in a way that our application (Excel) will be able to process.
We can represent names as text (a name of a customer), we can represent numerical information as whole numbers (e.g. number of items one may purchase), currency (a balance in a saving account), date (typically given as month/day/year), percentage (for example an interest rate on a savings account), etc. The example below shows examples of these types of data:

Our first task is then to determine what information will be needed, how will this information be represented as data, what information do we expect to compute (and what type of data will represent this information.
Let us illustrate this on a series of examples, continuing with additional steps that will lead us to solving the problem.
Example 1: Compute the interest accrued in a one year on in a savings account.
The information we need to define the computation is the balance in the savings account, and the yearly interest rate.
We choose to use monetary formatted data to represent the balance and the accrued amount information. We use percentage formatted data to represent the interest rate. We place the balance in the cell B12 and the interest rate in the cell C12. The cell D12 shows the computed value of the accrued interest and the cell E12 shows how we defined the computation in the cell D12.

Example 2: Extending the computation over a range of data.
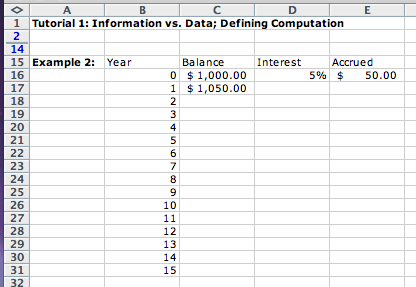
We now want to see how much money will be in our savings account after several years, if we do not withdraw the accrued interest, but let it remain in the account, earning additional interest.
We see that to define a computation we enter into the cell
= sign followed by a formula that represents the
computation, referring to the values in the specified cells.
We start by adding a new column to represent the year. To compute the
new balance we add the balance for the previous year and the interest
accrued in that year:

We extend first the range of years for which we want to compute the balance by highlighting the cells B16 and B17, then moving the cursor to the corner of the cell B17 until it changes its shape to a plain cross. We then hold down the mouse button and drag the hightlighting down until we cover years - through 15:

For values such as numbers and dates where the computer can figure out how to produce the next value we can fill a range of cells as follows. First we enter two consecutive values into two adjacent cells. We then highlight these two cells, move the cursor to a corner till it changes to the dragging mode (a simple cross), then drag over as many cells as we wish to fill. Each new cell will have the value that is a successor of its neighbor.
We now try to do the same for the interest calculations. Let us first compute the values for one more year:

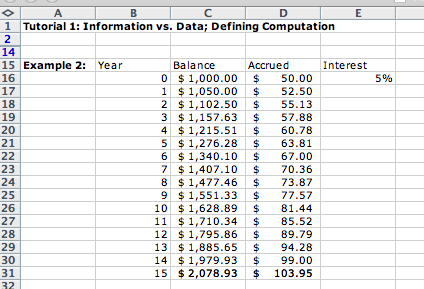
We see that while the Balance and Accrued values are changing, the interest remains the same. It is a bad idea to repeat a value that should stay fixed. We move the Interest to the cell E16 and change the computation for the Accrued values as shown:

Referring to the cell E16 as $E$16 indicates that even
when we drag the formula down or across, the computation should always
refer to the same cell. When we highlight a cell that contains a
computation that involves other cells, dragging the computation copies
the formula, changing the source cells down or across as the mouse
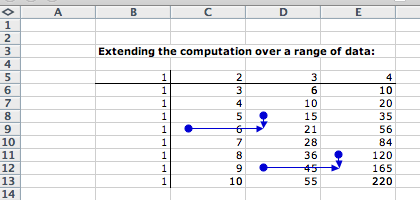
moves down or across. The following example illustrates this. We
started this example by filling the top row (cells B5:E4) and the left
column (cells B5:B13). We then defined the formula for the cell C6 as
=B6+C5 and dragged the formula both left and down. The
picture shows that the sources of the computation in the cell D9 are
the cells C8 to the left and the cell D8 above, and, similarly, the
sources of the computation in the cell E12 are the cells D12 to the
left and E11 above. (See Sheet2 of Tutorial1.xls)

We return back to our earlier example. We select cells C16 and D16 that represent the computation for the first year and drag both down all the way to the cells C31 and D31. We see that in 15 years we doubled our money:

Practice these skills and explore the Excel behavior on the following problems:
