Started 8/25/2001 by Bob Futrelle. Updated 5/27/2004.
27 May 2004: We've been working on edgelets in order to avoid having
to create large regions for PCAs which might overlap with adjacent
elements. I've since realized that by using only the connected components
of a pixel that we can avoid seeing nearby non-connected components,
which would basically solve the large-region problem.
In the meantime, Mingyan wants to pursure edgelets and clustering them
until she gets a result. That's an excellent way to proceed.
Mingyan's visualization of edgelets that she's developing uses
some of the tricks from my 9 April note below.
Notes on edgelets are here.
9 April 2004: Altering zoomed image display to show numerical pixel values. This page shows the image that results when zoomed into to 32x32 fat pixels. The five additional lines of code needed are on the page too.
In March 2004, we are deeply into developing a method to replace the PCA analysis. This is because the PCA window has to be too large when analyzing wide lines, e.g., 5 to 10 px wide. We want to replace this with a way to look only a tiny bit outside of a line edge. This can be done by finding skeletons or edges. Finding edges is the most compatible with our line models, so that is what we are pursuing here. Each operator, e.g., Sobel, is highly localized, producing what I call is an edgelet. The next step is to aggregate together enough edgelets to to produce a large enough edge segment for the placement of our edge model. These topics are discussed in this page I created 3/27/04. They also include links to some simple edglet java code I wrote, including javadoc.
10/4/2003: Well, Dan's moved Providence and to Brown University, so Bob and Mingyan are in charge of SVP now. Here are some notes by Bob on how to make SVP even better.
6/21/2003: Here are the Javadoc pages for Dan's "final" SVP system of 5/14/2003.
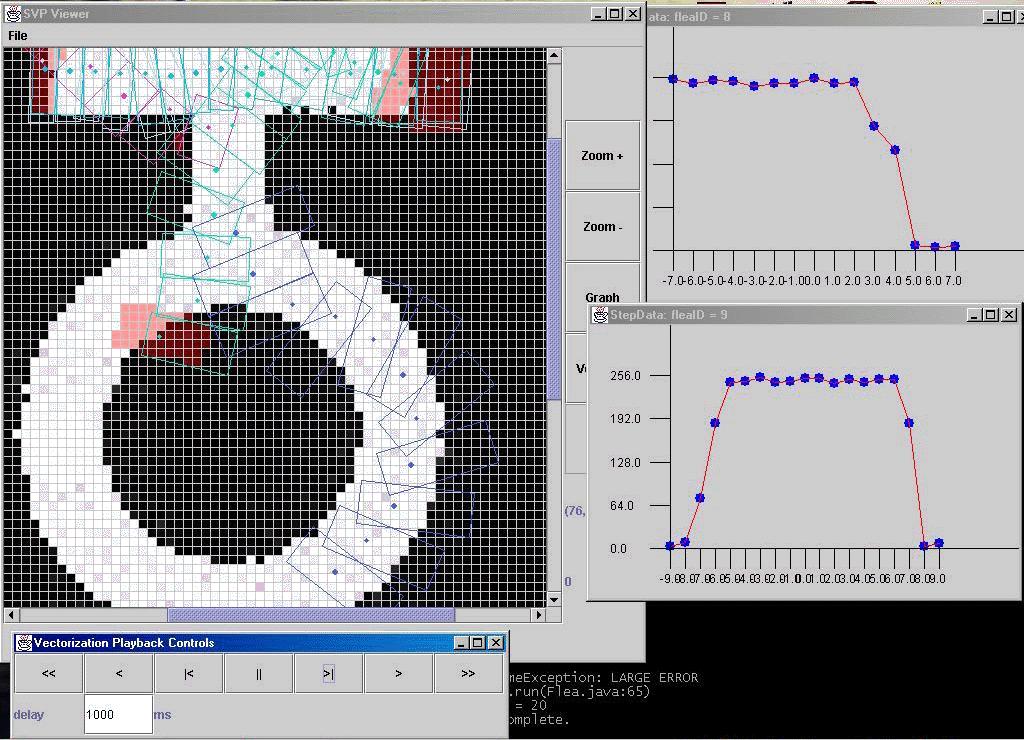
9/2/2002: Here's a great screen shot of Dan Crispell's visualization tools showing Mike's SVP in action.
1/22/2002: Mike Preshman and Bob will be working on the SVP project together this quarter. Then major advance in the last month is the development of a strategy to do omnidirectional Fleas, including curvature estimates. All that is in my Journal 97, pgs 142+ and 176+. I need to copy these for Mike. Also, he needs to look at Dan's code. It should be possible for him to cd directly to /proj/futrelle/svp/dan and study (and try to run) the code.
11/21/2001: "Oh Flea, Where Art Thou?" (Omnidirectional fleas)
11/18/2001: Here's my page with two figures and one detailed excerpt image from each. Also, a piece of email about visualizing the white border area and thoughts about fleas containing a collection of "perfect" segments.
Link to our SVP general resources page.
Link to our system strategies page.
This page is to keep the BKL lab generally informed of progress on this project, personnel, etc.
(9/29/01): A plan. How to proceed in the short term..
(9/29/01): Some successful experiments at loading a jpeg into a BufferedImage.
(9/28/01): Three tiny jpegs and 32x views of them.
Over the last few months I have come to the realization that I cannot make the kind of progress required on diagram parsing because of the lack of source material. There are millions of diagrams available in the electronic scientific research literature, e.g., via HighWire Press (HTML, jpeg) (including Science and the ASM journals), ACM (PDF), IEEE (HTML, gifs), Nature (HTML, jpeg) and many more. But essentially every diagram in all of these journals is in JPEG or GIF format or is a pixmap graphic in a PDF document. None of these are in vector format, so all of the line drawings of diagrams are represented by pixmaps. The HighWire articles that I've examined have these images in three sizes, with the largest being huge to capture all details, e.g., 1400x1800 pixels -- and they do! That is good for our work.
I've also learned that the extensive work I've done on parsing diagrams over the last decade has given me insights into their structure that should enable us to design world-class systems for turning these pixmaps into vector-based diagrams, the process of vectorization. As a (toy) example the jpeg below is a 135x58 pixel image, 2,829 bytes compressed, that could be represented simply by a line object containing two endpoint x,y value pairs occupying a total of about 30 bytes. So vectorization can save space in most cases, but more importantly, it represents the contents in a symbolic, object-based manner that we can analyze to discover the organization and content of the diagram.

You might ask: People have been working on pattern recognition for many decades. Isn't this problem solved already? Curiously enough, it hasn't. If you go to google and ask for the top-cited site on diagram understanding to see what's been done, it's a collection of references built around a paper I published on the subject in 1992. So it comes full circle. In any event, the problem of vectorization simply haven't been solved. If you look at the remarks on the problem by a leading lab, then once my methods have been perfected, you'll appreciate just how "old-fashioned" and non-strategic the current approaches are. I am truly excited and optimistic about my approach. I am convinced that it will be far more successful than all methods offered to date by others. I have had experience in the past doing image processing and teaching it at the graduate level, so I'm not a newcomer to the field.
Why "strategic"? I am treating the vectorization problem as a puzzle or game that requires a series of strategic "moves" to sort out what is present, rather than using a fixed series of image operations as in virtually all methods to date. There are people who attempt to use strategies, but they apply them after the low-level pixel-level analyses are completed. Some of the strategies I'm developing work right down at the pixel level and that is critical for the success of my approach.
SVP Reference: My two major batches of notes on SVP (as of 8/24/01) are Journal 91, pg. 143 and various following, and Journal 96, pgs. 172-178. These lay out, in text and drawings, strategies for vectorization.
SVP is one of the major projects of the lab over the next year, supported by the primary grant, devoted to diagram understanding. Two other diagram-related projects will be the diagrams.org website and the structure of diagram references and discussion in text. These latter two will be done working with Chris Benson. The other projects will involve natural language and, I hope, will shift to support from a separate NSF proposal in preparation.
Note: Since this project is absolutely in a "quiet mode" there will be some material on the web that is not even available to the entire BKL-associated group. But no matter, everyone will hear about progress from me informally, as things develop.