CS6140 Machine Learning
HW2A - Gradient Descent , Perceptron
Make sure you check the syllabus for the due date. Please
use the notations adopted in class, even if the problem is stated
in the book using a different notation.
Make sure to read the notes on Gradient Descent for Regression,
and chapter 5 of DHS, up to (including 5.6 Relaxation Procedures)
PROBLEM 1 [70 points]
A) Train/test Linear Regression L2-regularized (Ridge) with normal equations.
B) Train/test L2-reg Linear Regression using Gradient Descent (and then test) on
Spambase and Housing datasets form HW1.
C) Train/test Gradient Descent Logistic Regression on Spambase data.
D) Train/test L1-regularized Linear Regression on Housing data. Use the scikit-learn library call; appropriately set input params. Try different values of L1 penalty, and create a plot (X_axis=L1 value; y_axis=test performance)
Note: Normalization matters. When you
normalize data features (one feature at a time), you need to
normalize all data (train, test, validation) together, as opposed
to normalize separately training and testing sets.
Compare for each dataset training and testing performance across all
four learning algorithms by making a table like below
|
Decision or Regression Tree
|
Linear Regression (Normal Equations)
|
Linear Ridge Regression (Normal Equations)
|
Linear Regression(Gradient Descent)
|
LogisticRegression(Gradient Descent)
|
Spambase
|
Train ACC:
Test ACC:
|
Train ACC:
Test ACC: |
Train ACC:
Test ACC: |
Train ACC:
Test ACC: |
Train ACC:
Test ACC: |
Housing
|
Train MSE:
Test MSE: |
Train MSE:
Test MSE: |
Train MSE:
Test MSE: |
Train MSE:
Test MSE: |
N/A . - WHY?
|
For classification (Spambase), produce Confusion Matrices
(TruePos, FalsePos, TrueNeg, FalseNeg) for Decision
Trees, Linear Regression and Logistic Regression - three 2x2
matrices. You will have to use a fixed threshold for each
regression algorithm.
For classification (Spambase), produce ROC plots comparison
between linear regression and logistic regression - two curves.
Compute the AUC for each curve.
PROBLEM 2 [50 points] Perceptron Algorithm (Gradient Descent for
a different objective)
Step 1: Dowload the perceptron learning data set that I have created.
The data set is tab delimited with 5 fields, where the first 4
fields are feature values and the last field is the {+1,-1} label;
there are 1,000 total data points.
Step 2: Create a perceptron learning algorithm, as described in
class.
Step 3: Run your perceptron learning algorithm on the data set
provided. Keep track of how many iterations you perform until
convergence, as well as how many total updates (corresponding to
mistakes) that occur through each iteration. After convergence, your
code should output the raw weights, as well as the normalized
weights corresponding to the linear classifier
w1 x1 + w2 x2 + w3 x3 + w4 x4 = 1
(You will create the normalized weights by dividing your perceptron
weights w1, w2, w3, and w4 by -w0, the weight corresponding to the
special "offset" feature.)
Step 4: Output the result of your perceptron learning algorithm as
described above. Your output should look something like the
following:
[jaa@jaa-laptop Perceptron]$ perceptron.pl perceptronData.txt
Iteration
1 , total_mistake 136
Iteration 2 , total_mistake 68
Iteration 3 , total_mistake 50
Iteration 4 , total_mistake 22
Iteration 5 , total_mistake 21
Iteration 6 , total_mistake 34
Iteration 7 , total_mistake 25
Iteration 8 , total_mistake 0
Classifier weights: -17 1.62036704608359 3.27065807088159
4.63999040888332 6.79421449422058 8.26056991916346 9.36697370729981
Normalized with threshold: 0.0953157085931524 0.192391651228329
0.272940612287254 0.399659676130622 0.485915877597851
0.550998453370577
(Note: The output above corresponds to running on a different data
set than yours which has six dimensions as opposed to four. Your
results will be different, but you should convey the same
information as above.)
PROBLEM 3 [30 points]
Read prof Andrew Ng's lecture on ML
practice advice. Write a brief summary (1 page) explaining
the quantities in the lecture and the advice.
Read prof Pedro Domingos's paper on A
Few Useful Things to Know about Machine Learning. Write a
brief summary (1 page), with bullet points.
PROBLEM 4 [20 points, GR_ONLY]
Run Logistic Regression on the Spambase dataset, but using Newton's
numerical method instead of Gradient Descent. An intro to Newton's
method can be found in the lecture notes.
PROBLEM 5 [30 points]
Given a ranking of binary items by prediction score, the ROC is the
curve plotted of True Positives vs False Positives for all possible
thresholds. The AUC is the area under the ROC curve.
Prove that the AUC is also the percentage of item pairs (i,j) in
correct order.
As an illustrative example, the classifier output might be
-------------------------------------------
object score
truelabel
-------------------------------------------
A 100
1
B
99 1
C
96 0
D
95 1
E
90 1
F
85 0
G
82 1
H
60 0
K
40 0
I
38 0
The ROC curve is obtained by truncating the list above at all ranks,
and for each such threshold computing false-positive-rate and
true-positive-rate (and plot them).
The problem asks to show that the area under the ROC curve is
approximated by the percentage of pairs in correct order. In this
example the item pairs in incorrect order are (C,D), (C,E),
(C,G), (F,G)
PROBLEM 6 [optional, no credit]
DHS chapter 5 Pb 2 (page 271)
PROBLEM 7 [optional, no credit]
DHS chapter 5 Pb 5, page 271
PROBLEM 8 [optional, no credit]
DHS chapter 5 Pb 6, page 271
PROBLEM 9 [optional, no credit]]
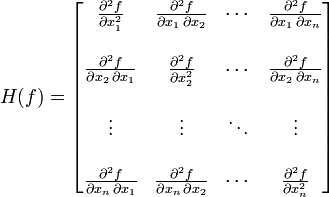
For a function f(x1,x2,..., xn) with real values, the "Hessian"
is the matrix of partial second derivatives
Consider the log-likelihood function for logistic regression
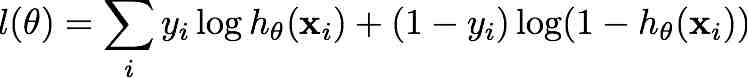
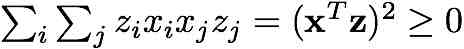
Show that its Hessian matrix H is negative semidefinite, i.e. for
any vector z satisfies
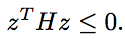
Remark: This fact is sometimes written
and implies the log-likelihood function
is concave.
Hint: