- Real world graphs are essential to research
- Great discoveries of the last 15 years all came from measuring real world graphs
- Models were later built to capture these features
- The next great discoveries will also come from measured graphs
- Graph dynamics
- Interactions, influence, and contagion
- Etc.
- How do researchers acquire real world graphs?
- Not as straightforward as it seems
- Many practical and theoretical challenges to collecting real graphs
Measurement and Analysis of Online Social Networks
Alan Mislove, Massimiliano Marcon, Krishna P. Gummadi, Peter Druschel, Bobby Bhattacharjee
Internet Measurement Conference 2007
Motivation
Ways to Acquire Graphs
- Go to a company and beg for data
- Go ask researchers for their data
- Go gather data yourself
Begging from the Man
- Advantages
- Quick and easy; no need to spend time crawling
- Possibility of getting complete data
- Access to hidden metadata, e.g.
- Disadvantages
- Most companies don't give data to unknown researchers
- Privacy: user data is often sensitive
- Economics: big data is often worth big money
- Company may not give you what you want
- Example: willing to give you the graph, but not user interactions
- You may be forced to sign an NDA
- May give the company right of refusal over your research findings
- Prevents you from sharing data with other researchers
- Most companies don't give data to unknown researchers
Asking Researchers for a Hookup
- Advantages
- Quick and easy; somebody already did all the work for you
- Basic analysis has probably already been done
- Disadvantages
- Set of real graphs in academia is quite limited
- Many graphs are incomplete, of suspicious quality
- Many are tiny (order of thousands of nodes)
- Almost all are simple, static snapshots: they lack all metadata and temporal information
- Some researchers don't release their data
- Some researchers can't release their data
- Remember those NDAs?
- Set of real graphs in academia is quite limited
DIY: Do it Yourself
- By far, the hardest method
- But in many cases, the only method
- Practical challenges
- If the site doesn't have an API, you have to scrape it
- Gathering lots of data requires lots of time
- Access to most sites is strictly rate limited
- Data may be hidden by privacy settings
- Gathering/storing data may violate website's Terms of Service
- Crawling methodology may introduce bias into the data
- Graphs are dynamic, constantly evolving
- What about disconnected components?
- Traditional graphs traversal methods (e.g. BFS, DFS) are biased
Practical Strategies for Crawling Graphs
- This paper crawls four graph datasets
- Flickr
- Livejournal
- Orkut
- YouTube
- Each one presents unique challenges
- Excellent case study of how to gather data and show it is representative

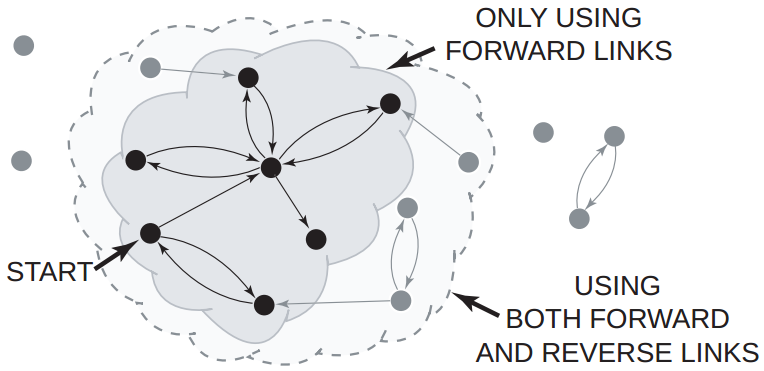
Crawling Flickr
- Photo sharing site
- Users may follow each other
- Graph is directed
- API for querying users and who they follow
- In other words, only forward links can be crawled
- Crawling strategy
- Pick seed users
- Perform a BFS of the graph, starting at the seeds
Problem: Data Completeness
Did the crawl locate all users?
Estimating Completeness
- Use uniform random selection to locate an unbiased sample of users
- In this case, 26.9% of 6902 random users where in the crawled data
- Are the remaining 73.1% of Flickr users "important"?
- Only 250 random users (5%) were connected to the WCC
- 89.7% of random users have zero forward links
- Only 11K new nodes discovered by BFSing from the 5043 random users
- Thus, it is likely that the crawl captured the majority of the large WCC
- Correlary: nodes disconnected from the large WCC only form small subgraphs
Crawling Livejournal
- Blogging site
- Users may follow each others blogs
- Following is much more common than on Flickr
- Graph is directed
- API for querying users, who they follow, and who follows them
- Forward links and reverse links can be crawled
- Thus, possible to completely crawl the large WCC
- Completeness estimated via random sampling
- 4773 random users out of 5000 (95.4%) present in the WCC
- Thus, the crawl is highly likely to be comprehensive
Crawling Orkut
- "Pure" social networking site
- Users friend each other, both sides must approve
- Graph is undirected
- Users must be invited to join by a friend
- Thus, Orkut forms a single, large SCC
- Challenges
- No API, HTTP requests are rate-limited, user population is very large
- Thus, a complete BFS crawl is impossible, even using 58 machines for >1 month
- Crawl gathered 3M of Orkuts 27M users (11.3%)
The Curse of Partial BFS
- Also known as Snowball sampling
- Partial BFS is biased towards gathering high degree nodes
- By definition the crawler is more likely to encounter high degree nodes
- Example: there are only two paths to locating user with degree = 2
- ... whereas there are 5000 paths to locate a user with degree = 5000
- Thus, the degree distribution of the Orkut sample is not representative
- Other metrics are not as severely impacted by this bias
- E.g. clustering and assortativity
Crawling YouTube
- Video sharing site
- Users may follow each other
- Graph is directed
- API for querying users and who they follow
- In other words, only forward links can be crawled
- Estimating Completeness
- User identifiers are user-generated strings, not numbers
- Thus, choosing a random sample of users is much more difficult (although not impossible)
- No estimates of completeness in this paper
Summary: Stategies for DIY Graph Crawling
- Perform a complete BFS
- How long will this take?
- If the graph is directed, how many nodes are missing from the WCC?
- Gather a uniformly random sample of nodes
- May not be possible on sites with irregular identifiers
- Partial BFS/DFS, a.k.a. Snowball Sampling
- Known to produce results with biased degree distribution
- Random Walk
- Also produces results biased towards high degree nodes
Building a Better Random Walk
- Assuming complete BFS and uniform random sampling are impossible...
- ... is there a way to sample the graph without incurring bias?
- Metropolis-Hastings random walk
- MCMC technique for sampling from a difficult to sample distribution
- Converges towards uniform random sampling
v = initial_seed_node
while stop_the_crawl is False:
  w = random.choice(v.neighbors)     # pick a neighbor at random
  p = random.random()                # 0 <= p < 1.0
  if p <= v.degree/w.degree: v = w   # walk to node w
  else: pass                         # stay at node v
- Not the only modified random walk algorithm for unbiased graph sampling
- Whole subfield of research dedicated to these algorithms
Today's Preferred Technique: Twitter Hoses
- Twitter offers streams of tweets sampled uniformly at random (sort of)
- Spritzer: available for free, 1% of all tweets
- Larger hoses available from third-parties like Gnip for a fee
- \($^5\) - Gardenhose, a.k.a. Decahose: 10% of all tweets
- \($^6\) - Halfhose: 50% of all tweets
- \($^7\) - Firehose: 100% of all tweets
- Twitter is (arguably) the most popular OSN for study because of this data
Final Thoughts
- Thinking critically about data gathering methodologies is key for evaluating study results
- Is the data complete?
- If the data is sampled, how was it sampled?
- Are there hidden assumptions or biases in the data?
- Developing sound methodologies is crucial to conducting your own research
- Think carefully about what data you need
- Is it possible to gather this data? If so, what are the challenges?
- Can you demonstrate that the data is free from bias, or the bias is quantifiable?
- GIGO
- Garbage In - Garbage Out
- If you start with poor data, the results are going to be even worse
Systematic Topology Analysis and Generation Using Degree Correlations
Priya Mahadevan, Dmitri Krioukov, Kevin Fall, Amin Vahdat
SIGCOMM 2006
Limits of Real World Graphs
- Real world data is always good, but it isn't without challenges
- Hard to obtain, often incomplete or biased
- Few datasets in existence
- Are findings statistically significant if you only have 1 graph?
- Possible solution: use models to generate synthetic graphs
- Infinite graph samples can produce high statistical confidence
- No privacy issues, easy to share data
Limits of Graph Models
- How do you fit a model to a given real world graph?
- Models have parameters that must be set
- How do you choose parameter values such that model output is close to a given real world graph?
- Existing models are feature based
- Preferential Attachment produces power-law degree scaling
- Wattz-Strogatz produces tight-clustering and low path lengths
- Forest Fire produces shrinking graph diameters
- What about other features, or combinations of features?
- Existing models are not future-proof
- How can a model capture features that haven't been identified yet?
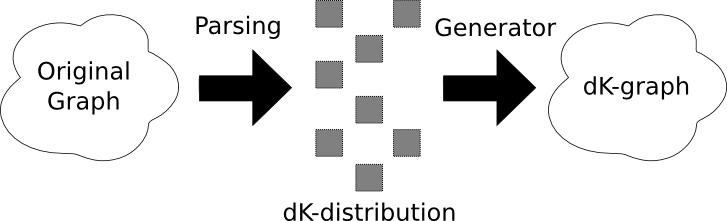
\(d\)K-distributions and \(d\)K-graphs
- Simple but very powerful set of concepts
- First, extract a distribution from a given real graph
- The \(d\)K-distribution acts like a fingerprint for the real graph
- Single parameter, \(d\), controls amount of information captured by the distribution
- As \(d\) increases, more information is extracted
- Second, a generator synthesizes a new graph based on a \(d\)K-distribution
- Resulting graph is known as a \(d\)K-graph
- Generator is stochastic; possible to generate many \(d\)K-graphs
- ... however, \(d\)K-graphs are also statistically similar to the original graph
- Similarity increases as \(d\) gets larger
Flow Chart
\(d\)K-distribution Example
- 0K (average degree):
- \(\overline{k} = 2\)
- 1K (degree distribution):
- P(1)=1, P(2)=2, P(3)=1
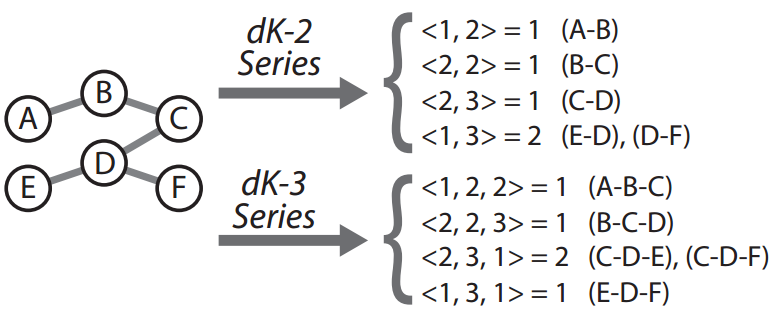
- 2K (joint degree distribution):
- P(1,3)=1, P(2,2)=1, P(2,3)=2
- 3K (clustering):
- P(1,3,2)=2, P(2,2,3)=1
- 4K:
- P(3,2,1,2)=1
Another \(d\)K-distribution Example
1K-graph Generation
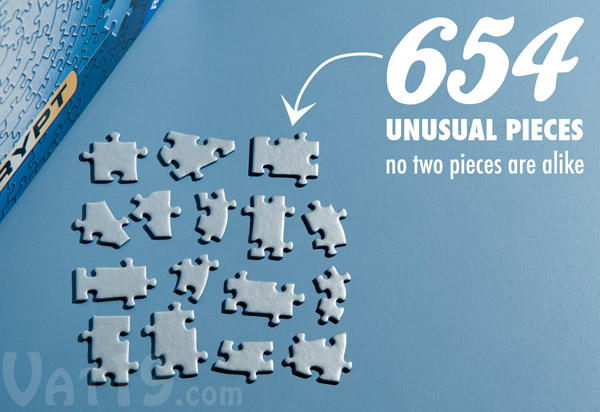
- Like a puzzle where all pieces are identical
- Very easy to put all the pieces together
- But, many possible arrangements
2K-graph Generation
- Like a puzzle where some pieces are identical
- More types of pieces mean more constraints on valid constructions
- Relatively harder to put together, still easy in an absolute sense
- Less possible arrangments than before, but still significant freedom
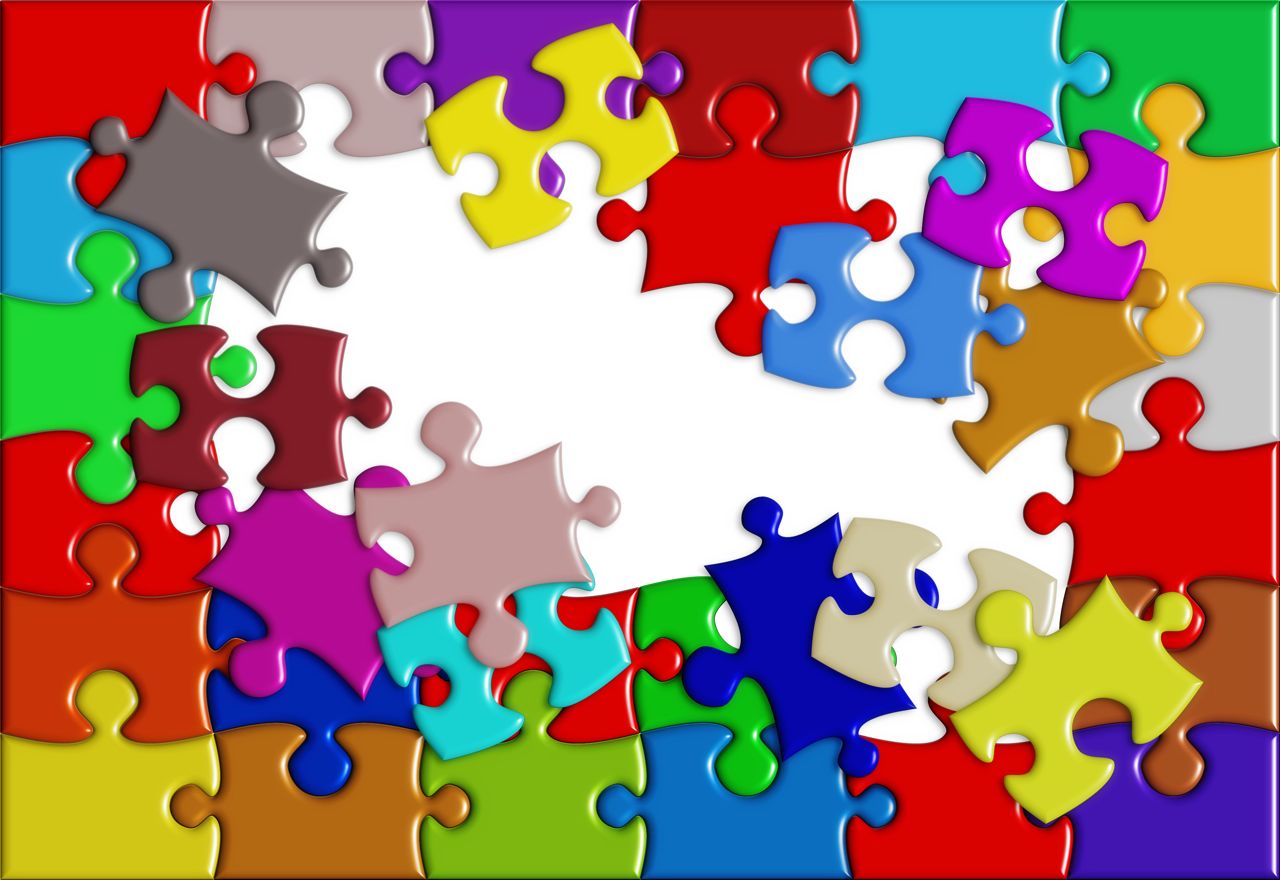
\(n\)K-graph Generation
- Like a puzzle where no pieces are identical
- Only one possible construction
\(d\)K-graphs of Increasing Specificity
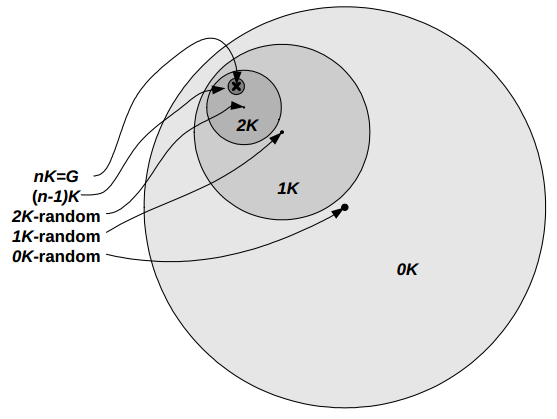
Constraining \(d\)K-graphs
- 0K - How many graphs have \(n\) nodes and average degree \(k\)?
- 1K - How many graphs have avg. degree \(k\) and a specific degree distribution?
- Recall the experiment where we randomly rewired the edges of graphs...
- 2K - How many graphs have avg. degree \(k\), specific degree distribution, and JDD?
- 3K - How many graphs have avg. degree \(k\), specific degree distribution, JDD, and clustering distribution?
- 4K - Etc...
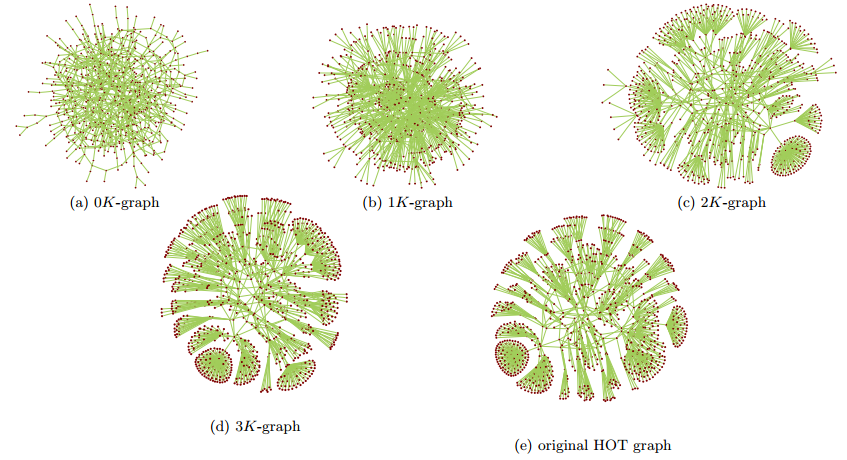
\(d\)K in Action
\(d\)K Summary
- Method for deriving distributions from real graphs...
- ... and generating synthetic graphs from those distributions
- Advantages over existing models
- Based purely on graph structure, not tied to specific features
- As \(d\) heads to infinity, captures target graph with perfect accuracy
- In practice, \(d = 3\) is sufficient to capture all currently known features
- No need to tune individual model parameters
- Disadvantages
- Generators for \(d > 2\) are extremely slow and complex
- Currently, there is no 3K generator capable of synthesizing large graphs